
Main Table
The table displays the statistical indicators by clusters (refer to Figure 1).
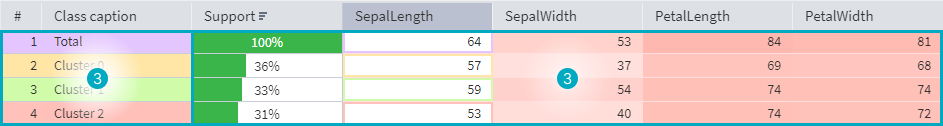
The table can be conventionally divided into 2 areas:
Legend Columns
Legend columns consist of the following columns:
- Clusters in rows:
- #: number of row.
- Cluster caption: the order cluster number and Total cluster that contains the general information on clusters if it is possible to calculate the common value for the current indicator.
- Support: the ratio of the data rows count in the cluster to the total count of data rows.
- Clusters in columns:
- #: number of row.
- Field caption: field caption from the source data set.
- Type: kind of the field data.
Note: It is not allowed to deselect Legend columns, with the exception of Support column.
Data Columns
Data columns consist of the following columns:
- Clusters in rows:
- Field caption: field caption from the source data set.
- Clusters in columns:
- Cluster caption: the order cluster number and Total cluster that contains the general information on clusters if it is possible to calculate the common value for the current indicator.
- Support: the ratio of the data rows count in the cluster to the total count of data rows.
Actions in the Table
- Single sorting: sort the column by the current Indicator. It is possible to select the sorting type in two ways: via the caption menu of the selected column by clicking on
 button and clicking on the column. When clicking on the column, the sorting is cyclically switched between the following types:
 Ascending.
 Descending.
- Clear sort.
- Drag columns: change location of columns relative to eaсh other. For this purpose, it is required to hold down the left mouse button on the column caption to be dragged and then move the mouse cursor to the required place and release the left mouse button.
- Freeze/unfreeze column: freeze/unfreeze the column. For this purpose, it is required to click on button in the column caption menu, select
 Unfreeze column or
  Freeze column menu option.
 - Hide/display legend columns: show/hide legend columns. For this purpose, it is required to click on button in their caption menu, select
 Columns menu option and check/uncheck the columns to be hidden or shown.
 - Select cells: select the table cells. There are two selection modes:
- Single resets all current selection and selects only the current cell. Selection can be moved using the following keyboard keys: Up, Down, Left, Right.
- Multiple selects several cells at once. To use the multiple selection, it is required to hold down Ctrl key that enables to add the cell to the selected ones or delete the cell from them. If several cells are selected, the following change of the current field is possible:
- Using Up, Down buttons if fields are in rows.
- Using Left, Right buttons if fields are in columns.
Note: It is possible to select only the cells within one field. It is possible to select not more than 7 cells at the same time.
Histograms
Histograms contain three types of columns:
- Null column: the column with missing values in the discrete histograms. Column visibility can be changed using
 Show null column in histograms button on the Toolbar.
 - Main columns: the histogram that displays the columns of the discrete histograms and the solid fill under the continuous smooth curve of the continuous ones.
- "Other" column: the column with the accumulated values for which there was no enough space in the discrete histograms. Column visibility can be changed using
 Show "Other" column in histograms on the Toolbar.
Note: The current restriction of the column count for the discrete histogram in the cell — 12.