
 Cluster Profiles
Cluster profiles visualizer is designated for view of different statistical indicators of clusters, cluster structure and their comparison with each other.
Interface
The main window will be opened after addition to the visualizer node (Figure 1):
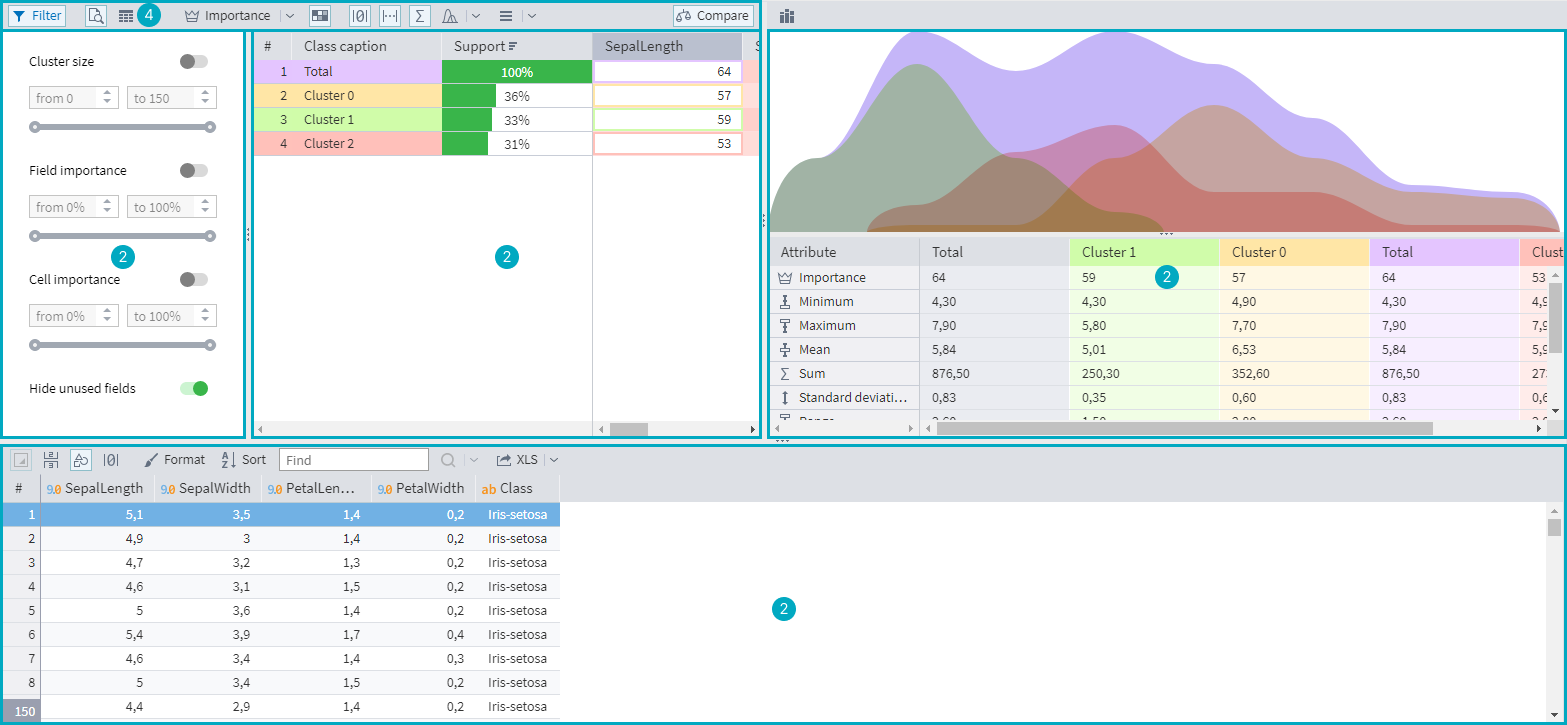
The main window can be conventionally divided into 5 areas (refer to Figure 1):
- Main table displays information on
- Filtration panel contains filtration settings of the Main table.
- Cluster comparison panel contains the comparative information on the clusters selected in the Main table.
- Toolbar provides configuration of the displayed data.
- Detailing shows the source data set data filtered by the clusters selected in the Main table.
Note: Sizes of Filtration panel, Cluster comparison panel and Detailing can be changed by dragging the separator line with the left mouse button. The area will be hidden by double clicking on the separator line or single clicking on the middle part of the line.
Articles in Section: